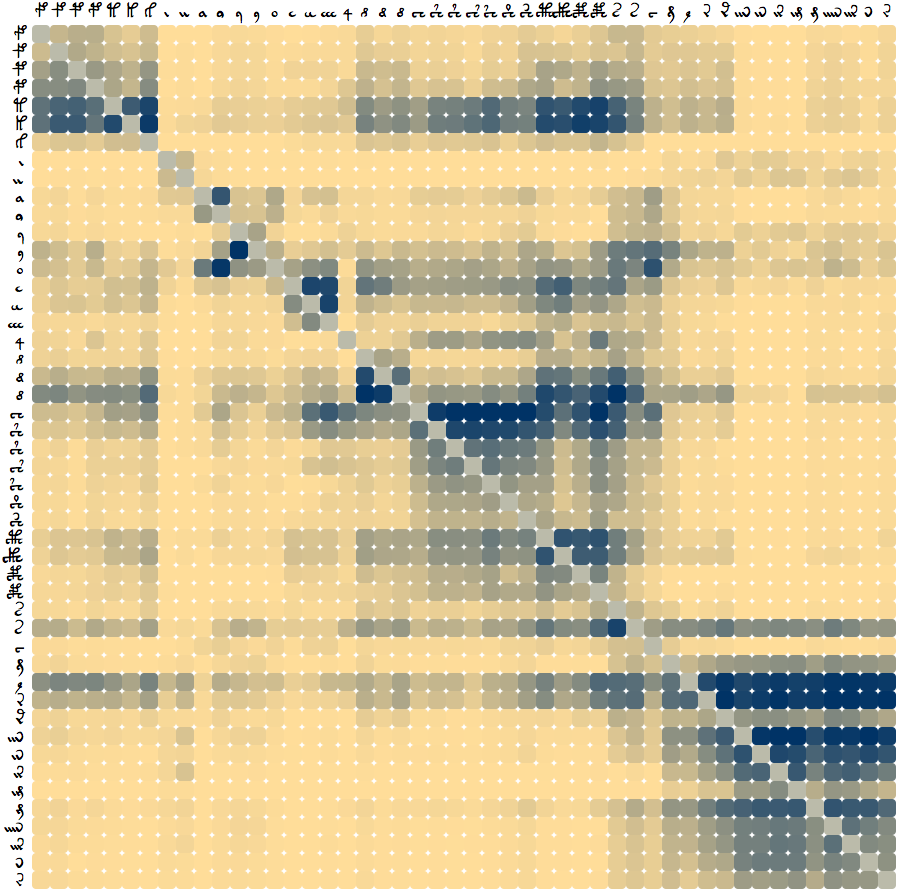
This chart shows one measure of how closely related the glyphs of the Voynich MS are. The more blue a square is, the more likely it is that the glyphs relate.
The intention of this chart is to group and classify the glyphs of the Voynich manuscript using techniques from computational linguistics. Numerous metrics are possible, but this one produces results which are compatible and consistent with existing findings and common sense.
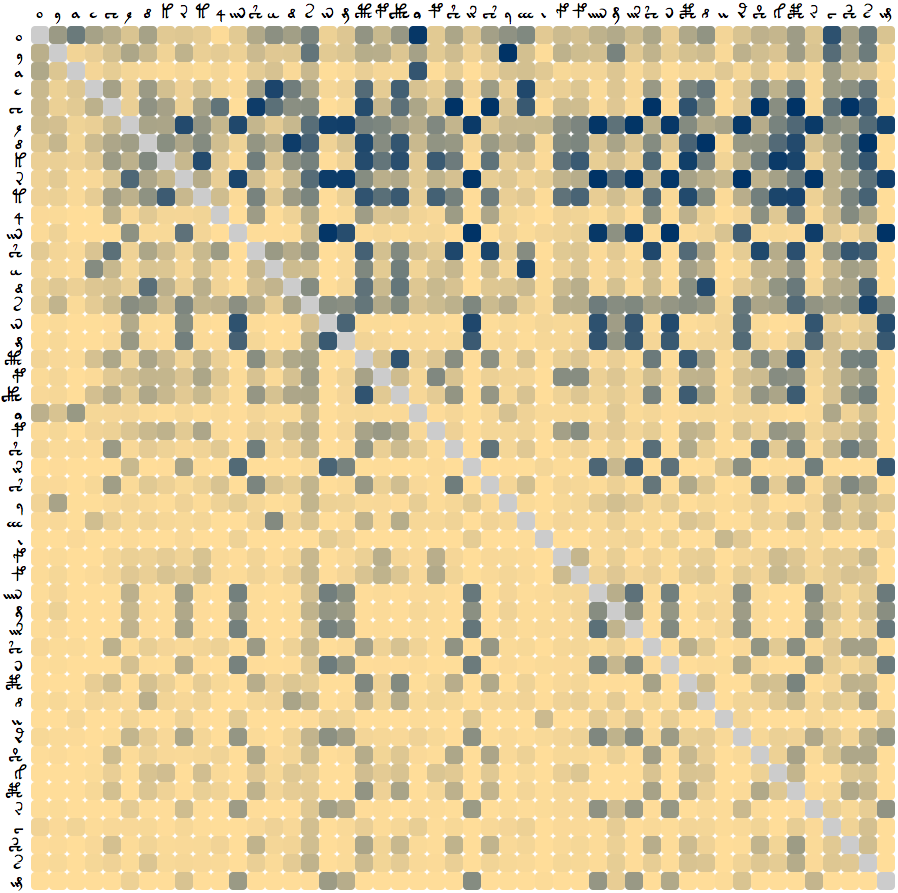
Glyphs have been manually ordered to make the groupings more obvious. The same chart ordered by glyph frequency is available below. The more deep-blue a square is on the intersection between two glyphs, the more likely those glyphs are to be related according to the metric used to produce the chart.
The method will be explained in technical terms further below. The non-technical explanation is that to find which glyphs are related, we swap every possible pair of glyphs and then measure the how unpredictable the resulting text is. The more predictable the text after a swap, the more likely those glyphs are to be related in some way.
As well as further analysis, explanation, and discussion of the motivation behind this chart, this article also provides the original data and programs used to create it, under permissive licenses.
Glyphs that share visual similarity usually belong to the same group. There are four main groups:
Groups (1) and (3), the gallows and the 1 family, are the two most closely related groups, especially when k and h are considered. These groups are not adjacent on the chart because of the existence of the interesting hybrids s and t, which appear to belong to some extent to both (3) and (4).
The grouping of glyphs by their appearance is a common sense result to some extent for the Voynich MS, but it is important to consider that it would not be so for some other languages. In English, for example, "d" and "b" are mirror images of one another, but this is very unlikely to show up in a similar analysis of an English text.
The chart is especially valuable for discovering which dissimilar looking characters are most related. A good example is 4, which bears very little resemblance to any other character, and only ever appears at the beginning of a word. This is an unusual character, but what is it most related? According to the diagram, we can now take a guess: the 1 group is the most closely related. One noteworthy aspect of this observation is that the effect is not due to mere proximity. If that were so, we would expect 4 to be related to other glyphs that commonly appear at the beginnings of words, such as the gallows. But in fact the chart shows these to be unrelated.
Another result is that i bears very little relation to all of the other glyphs that are based on the i shape, even though all of those other glyphs do bear relation to one another. In other words, i itself appears to be an outlier amongst all of the visually similar i glyphs. This matches the positional analysis of the glyphs where i was found to come much earlier on average in Voynich MS words.
s, e, and y seem to have some relation to almost all other characters, especially in the horizontal view, looking along their rows from the left. The only other glyph showing something like this property is o.
The chart was produced using the method described by Sravana Reddy and Kevin Knight in section 3.2 of their paper What We Know About The Voynich Manuscript, whilst talking about the gallows characters:
Another hypothesis is that gallows are upper-case versions of other characters. We define BESTSUB(c) to be the character x that produces the highest decrease in unigram word entropy when x is substituted for all instances of c. For English uppercase characters c, BESTSUB(c) is the lowercase version. However, BESTSUB of the VMS gallows is one of the other gallows! This demonstrates that they are not uppercase versions of other letters, and also that they are contextually similar to one another.
Though Reddy and Knight do not seem to make the specific details of their algorithm, or their code, available, this is enough to follow their method, which is interpreted and adapted as follows:
The values obtained by this process are those plotted on the chart.
One implementation detail is that the change in UWE decreases when the frequency of the glyphs in each pair is lower. When a rare glyph is substituted by another rare glyph, the UWE change will be very low. To compensate for this, the values plotted on the chart in the x-axis, where this effect is most acute, are relative to the maximum and minimum UWE changes within each glyph on the x-axis. The effect also manifests, to a lesser extent, on the y-axis. This was compensated for in a linear manner. Other schemes were attempted especially for the x-axis compensation. The linear method was tried first, and then the frequencies of the words were used. Neither method produced results as suitable as the relative change per glyph on the x-axis.
The creation of this diagram was prompted by a query on the VMS-list, about whether 4 could be a capital letter. Not only do Reddy and Knight appear not to have made their algorithm and code available, but they also did not describe the results for any glyphs other than the gallows characters. They also did not provide quantitative data, or further analysis. This article attempts to fill that gap, and provides a brand new independent analysis based on the same algorithm. Notably, Reddy and Knight's original finding for the gallows characters is repeated in the present results too.
If the quality of the data and algorithm used were perfect, then the two symmetric sides of the diagram, across the diagonal axis spanning from top left to bottom right, ought to match perfectly.
Update: Based on a conversation regarding the chart, it became clear that glyphs can still be related even if they do not display symmetry on the chart. The argument is as follows:
We agree that "T" and "t" in English are strongly related. But when we replace "T" with "t" in the sentence initial word "Total" we get "ToTal", which is not a valid word. When we replace "t" with "T", we get "total", which is valid.
Therefore "T" and "t" in English are not symmetric, but are very closely related. And the notion of case is just one possible reason why this may happen.
Of course, the Voynich MS is not English, and we don't know what mechanisms may be producing the data in the chart. But this rules out a lack of symmetry as necessarily showing glyphs not to be related. In other words, it may still be so, but it is not a proof.
An interesting conclusion from this is that certain kinds of relation may be ruled out by a lack of symmetry. For example, lack of symmetry is compatible with case, but it wouldn't be compatible with some non-positional scribal variants.
Instead of ordering the chart manually by groups, it is also possible to order it by frequency. This gives the following chart:
Reddy and Knight's approach of swapping glyphs and measuring word unigram entropy was not the only one attempted. Another approach used, instead of the step of measuring the word unigram entropy, was to measure the entropy by compression. The algorithm used was bzip2. This yielded the following diagram:
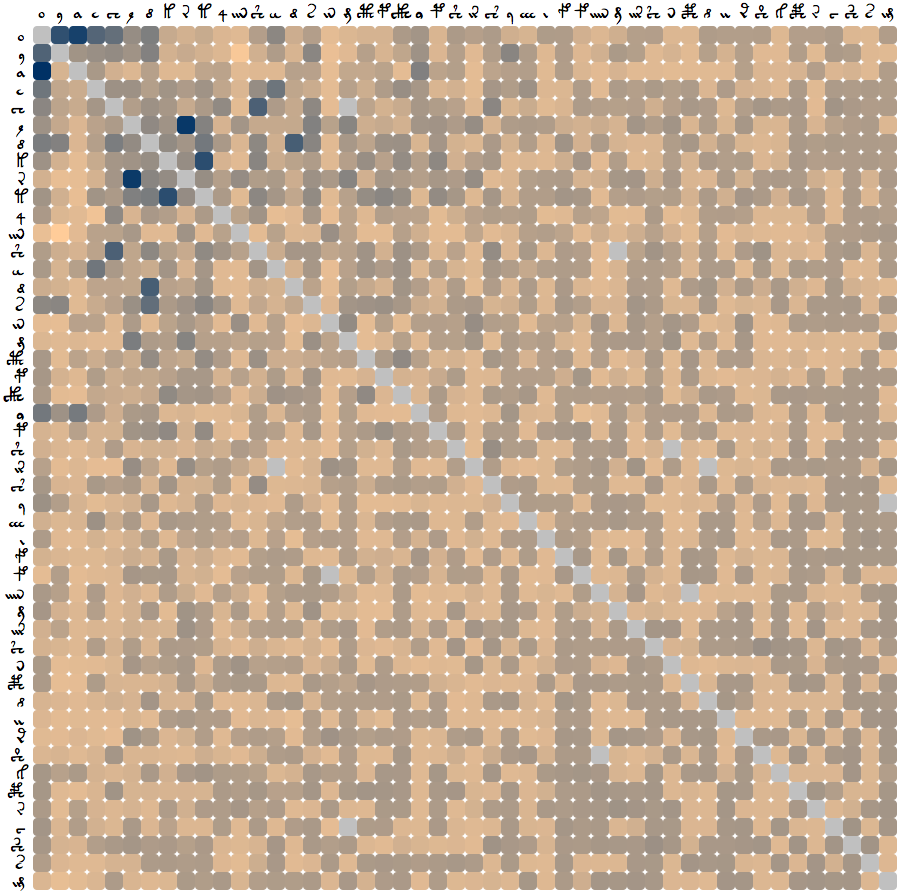
This chart bears a high degree of similarity with the chart just above, but only in the top left hand corner. As you move towards the right and bottom of the diagram, the similarity gradually fades as the data becomes more uniform. This is because the data is sensitive to the frequency of the characters, and the characters are ordered in the diagram by frequency. This means that the characters towards the right and bottom are more rare, and hence there is less data available for them.
Since bzip2 turned out not to be a very sensitive algorithm, it did not perform very well for the rarer glyphs. It did, however, confirm the validity of the results produced in the graph above, since it matches that for the upper left hand portion of the diagram.
Many kinds of further work are possible. One of the most useful would be to group the glyphs so that the total connections could be more easily seen as groups. A network diagram would be a good way to display this, though other methods are possible. A weighted version of Tarjan's algorithm could, for example, be used for provide a total ordering.
Glenn Claston's Voynich 101 transcription was used for the source of this analysis. A short python program was used to parse the data, which was then plotted using a CoffeeScript program and d3.js. The files and data are available:
To prepare the data, run:
$ python3 related_prepare.py > voynich101_comma.txt
Then you should be able to replicate related_data.tsv using the following command:
$ python3 related_parse.py > related_data.tsv
Claston's transcription was chosen because of the high degree of granularity regarding the glyphs. No other transcription comes close to providing the same amount of detail. Only the 48 most common glyphs were used in this analysis. 48 was chosen because it would have been difficult to display much more data in an easy to consume manner.
The charts are licensed under CC by-sa 4.0. The source code and data linked above are licensed under the Apache License 2.0.
The voynich-101.woff font used in this document, and in the chart, was prepared for me by David P. Kendal from the original public domain VOYNICH.TTF font by Glenn Claston. I am also very grateful for Claston's work on the font and transcription, and his commitment to place the font in the public domain. Much thanks to Ulises Cerviño Bersi for fixing a bug in my entropy code. Credit does not imply approval or otherwise of this article, excepting that David P. Kendal requires that I mention his explicit approval of my work.
Sean B. Palmer, June 2014